research process
The following is a typical research process for me, using a poster I made for a policy study program as an example.
1. choosing a topic
This particular project was inspired by a talk I attended at the Learning Policy Institute. The Flat World and Education: How America's Commitment to Equity Will Determine Our Future by Dr. Linda Darling-Hammond was extremely influential for me in college, so I wanted to view more of her line of work. I happened to attend a talk by Dr. Susan Loeb, who would become another influential figure for me.
Dr. Loeb spoke of her work at the Annenberg Institute finding evidence-based tutoring practices. The focus of their work is on equitable education, one of my strongest academic interests. My own experience as a tutor pushed me to choose this as my research topic for the quarter; for my entire tutoring career, I'd been frustrated at how little pedagogical training I'd been given. I wanted a better way to ensure that students were getting the support they deserved.
The institute has published some data on tutoring organizations, recording certain elements of their practices and approach. I decided to analyze this data to determine what factors were associated with organizations' likelihood of fitting the criteria for tutoring best practices.
This project gave me virtually unlimited freedom. For other projects I've done in the past, I've started from seed papers given to me by my graduate student advisor and designed my own studies to test my resulting questions, or gathered information on a specific policy topic in order to write a two-page briefing for state officials.
2. literature review
Where I look for prior publications on a topic depends on the project in question. For policy research, I use the California State Code and the United States Code to examine source text. For the present research, I used education and psychology databases, available through my university library. If I were conducting a systematic review, I would develop a pre-defined set of keywords and boolean conditions; for this project, I did not.
I organize my sources using Zotero. I use the first-second-third read process to scan abstracts to see if they fit my purposes, skim the discussion to get an idea of the findings, and finally do a full read with annotations to record my questions and mark important evidence. For central sources, I'll write a summary of each section and store these notes in an annotated bibliography.
I also decided to examine the California Education Code for mentions of tutoring. I found that the content of tutoring programs was not regulated, although my review was not exhaustive.
Overall, I looked for three main streams of evidence: papers on the conditions needed for effective tutoring; laws regulating the quality of tutoring services; and papers on the use of tutoring in education policy.
3. analysis
Although I have designed studies in the past, involving ethics reviews, sample selection, study registration and amendments, online study hosting, participant debriefing protocols, and more, this study utilized the vast trove of data that is freely available online. (For an example of my primary data-collection approach, check out my Undergraduate Research Fellowship project on equity in computer science).
I cleaned and analyzed the Annenberg Institute dataset on tutoring organizations in R. I had studied the tidyverse workflow extensively the past summer, and was prepared to perform analysis relatively straightforwardly. However, at the time my statistics knowledge was only about 2 courses' worth, and I performed a T-test on correlational data that probably would have been better analyzed by checking correlational significance.
For a multi-person team, I would share the cleaning documents and any custom functions using GitHub for version control. Although I worked solo on this project for my policy program, for demonstration purposes I uploaded the R files to GitHub, which you can view by following the link.
4. writeup
You can view the full paper online. In this paper, I argue for incentives embedded in policy to ensure that attempts to use tutoring towards educational equity is high-quality and likely to produce actual benefits for students.
5. poster
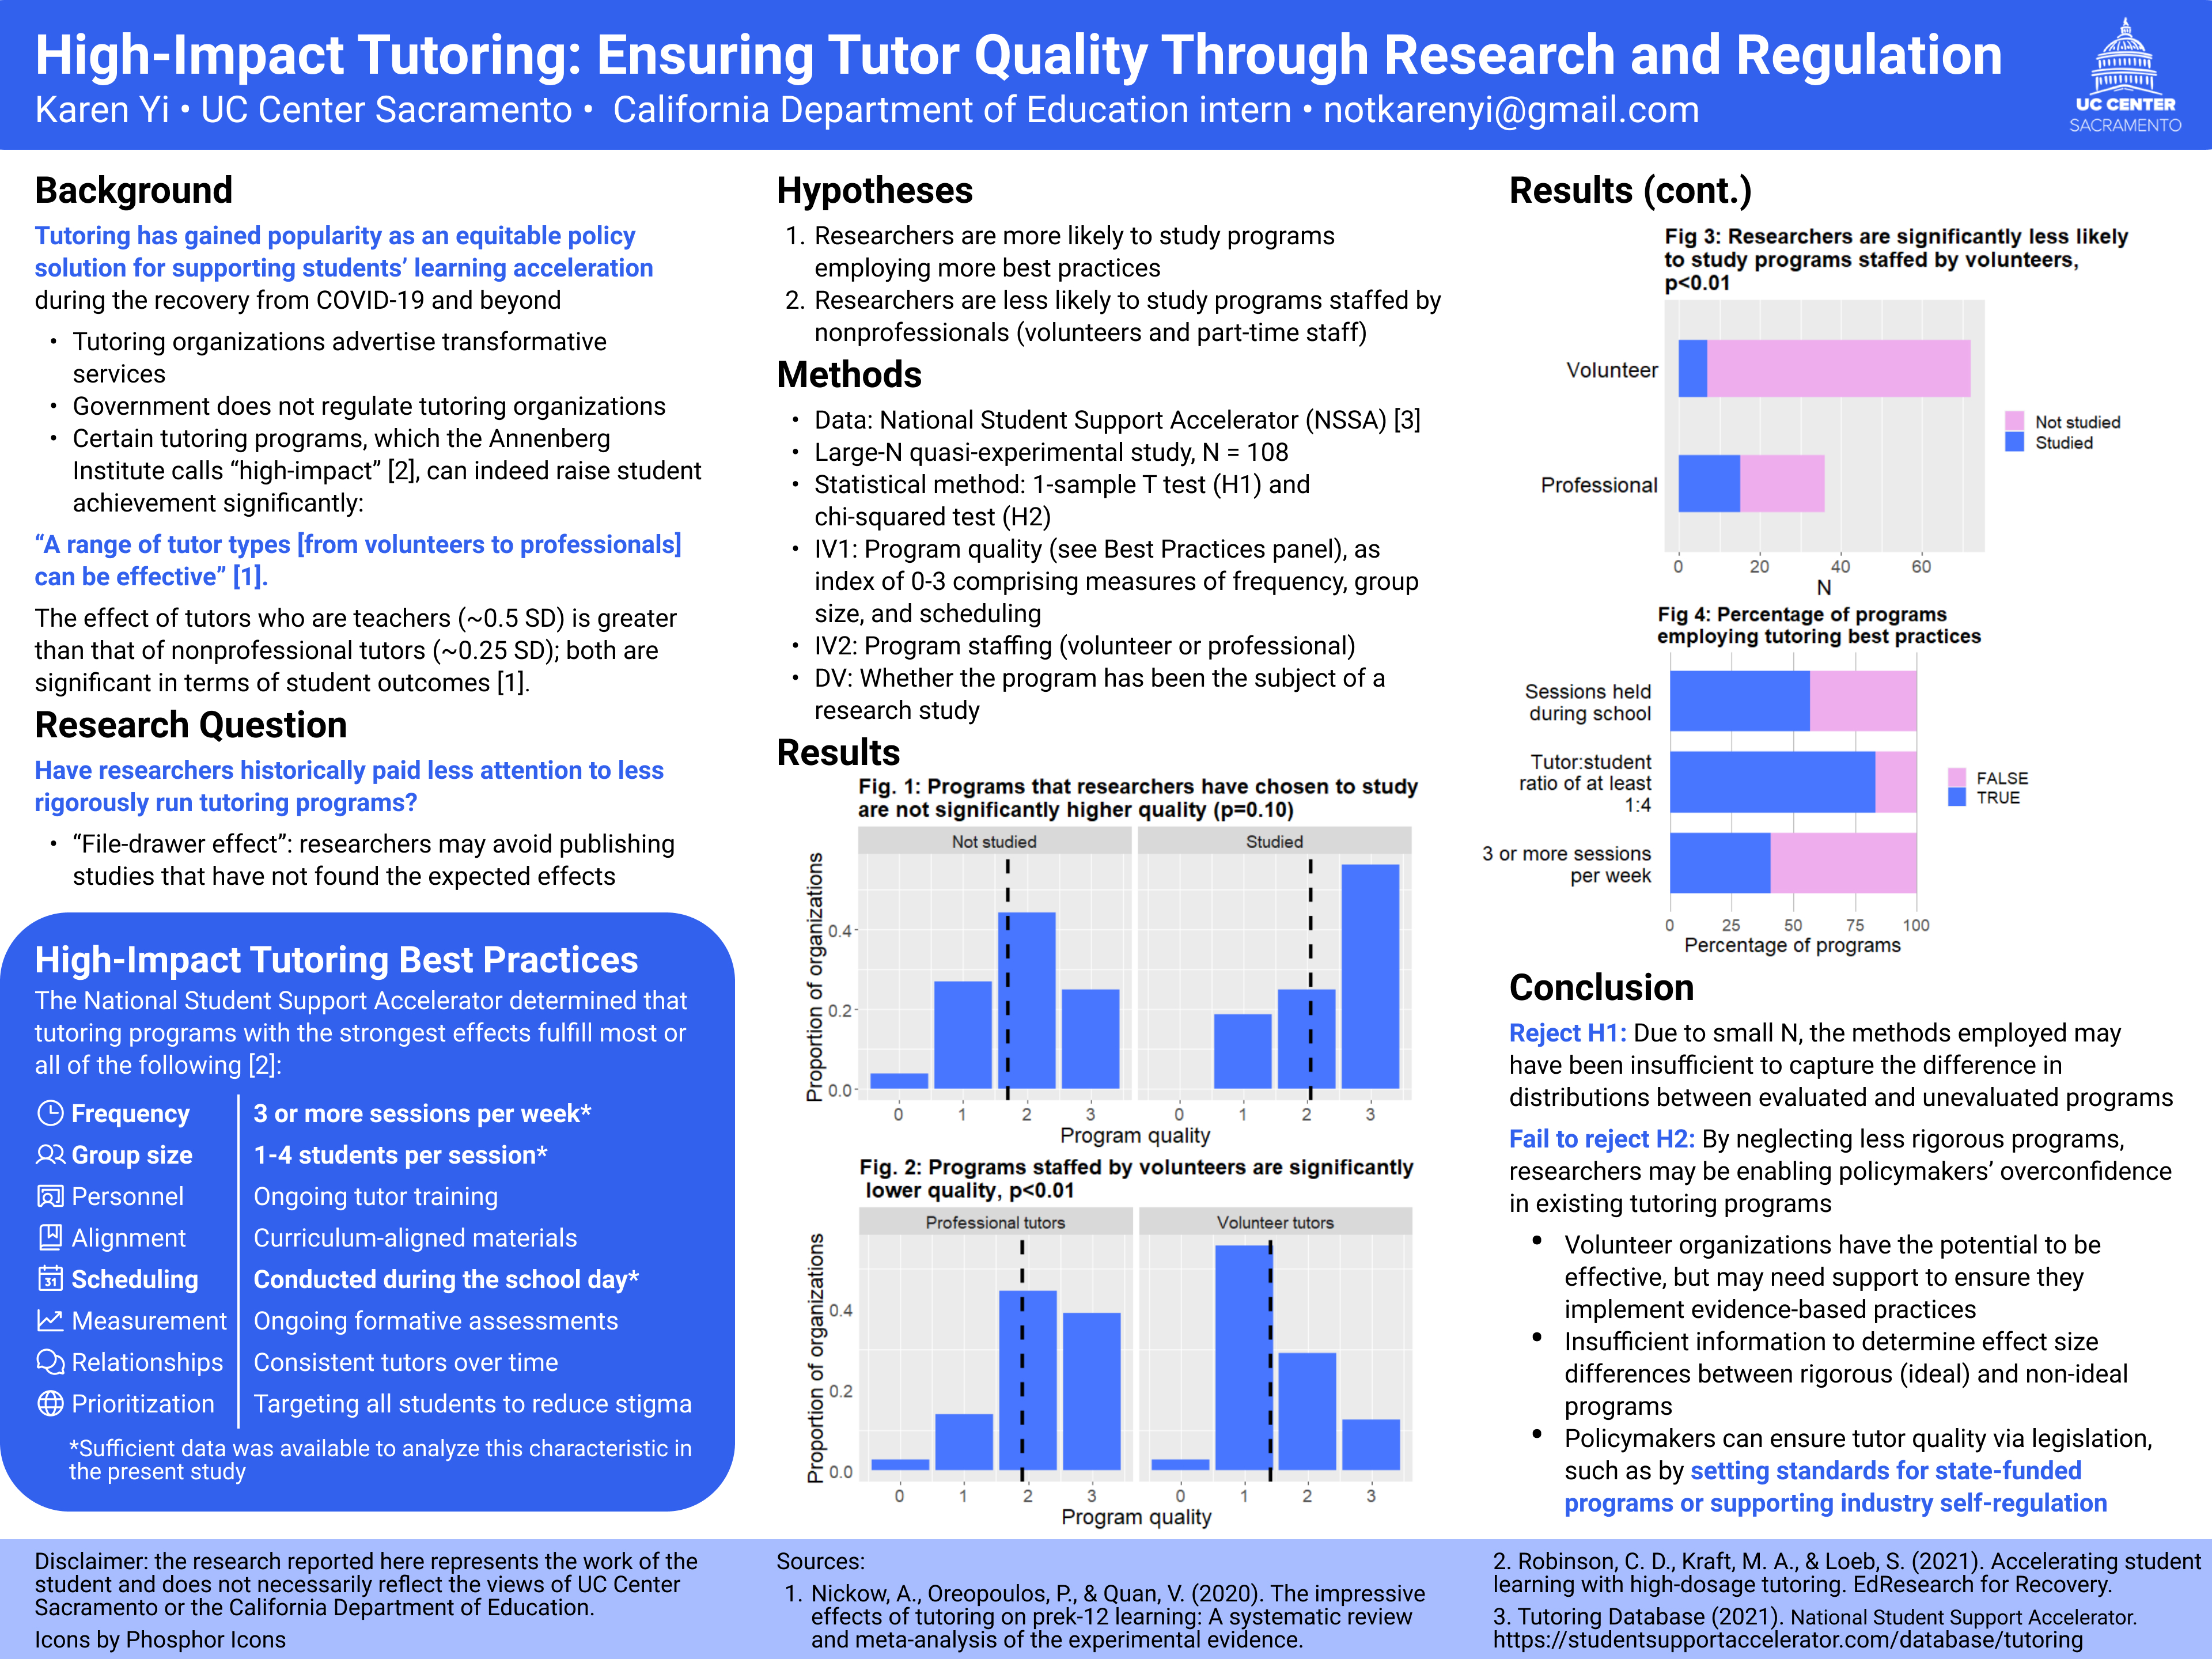
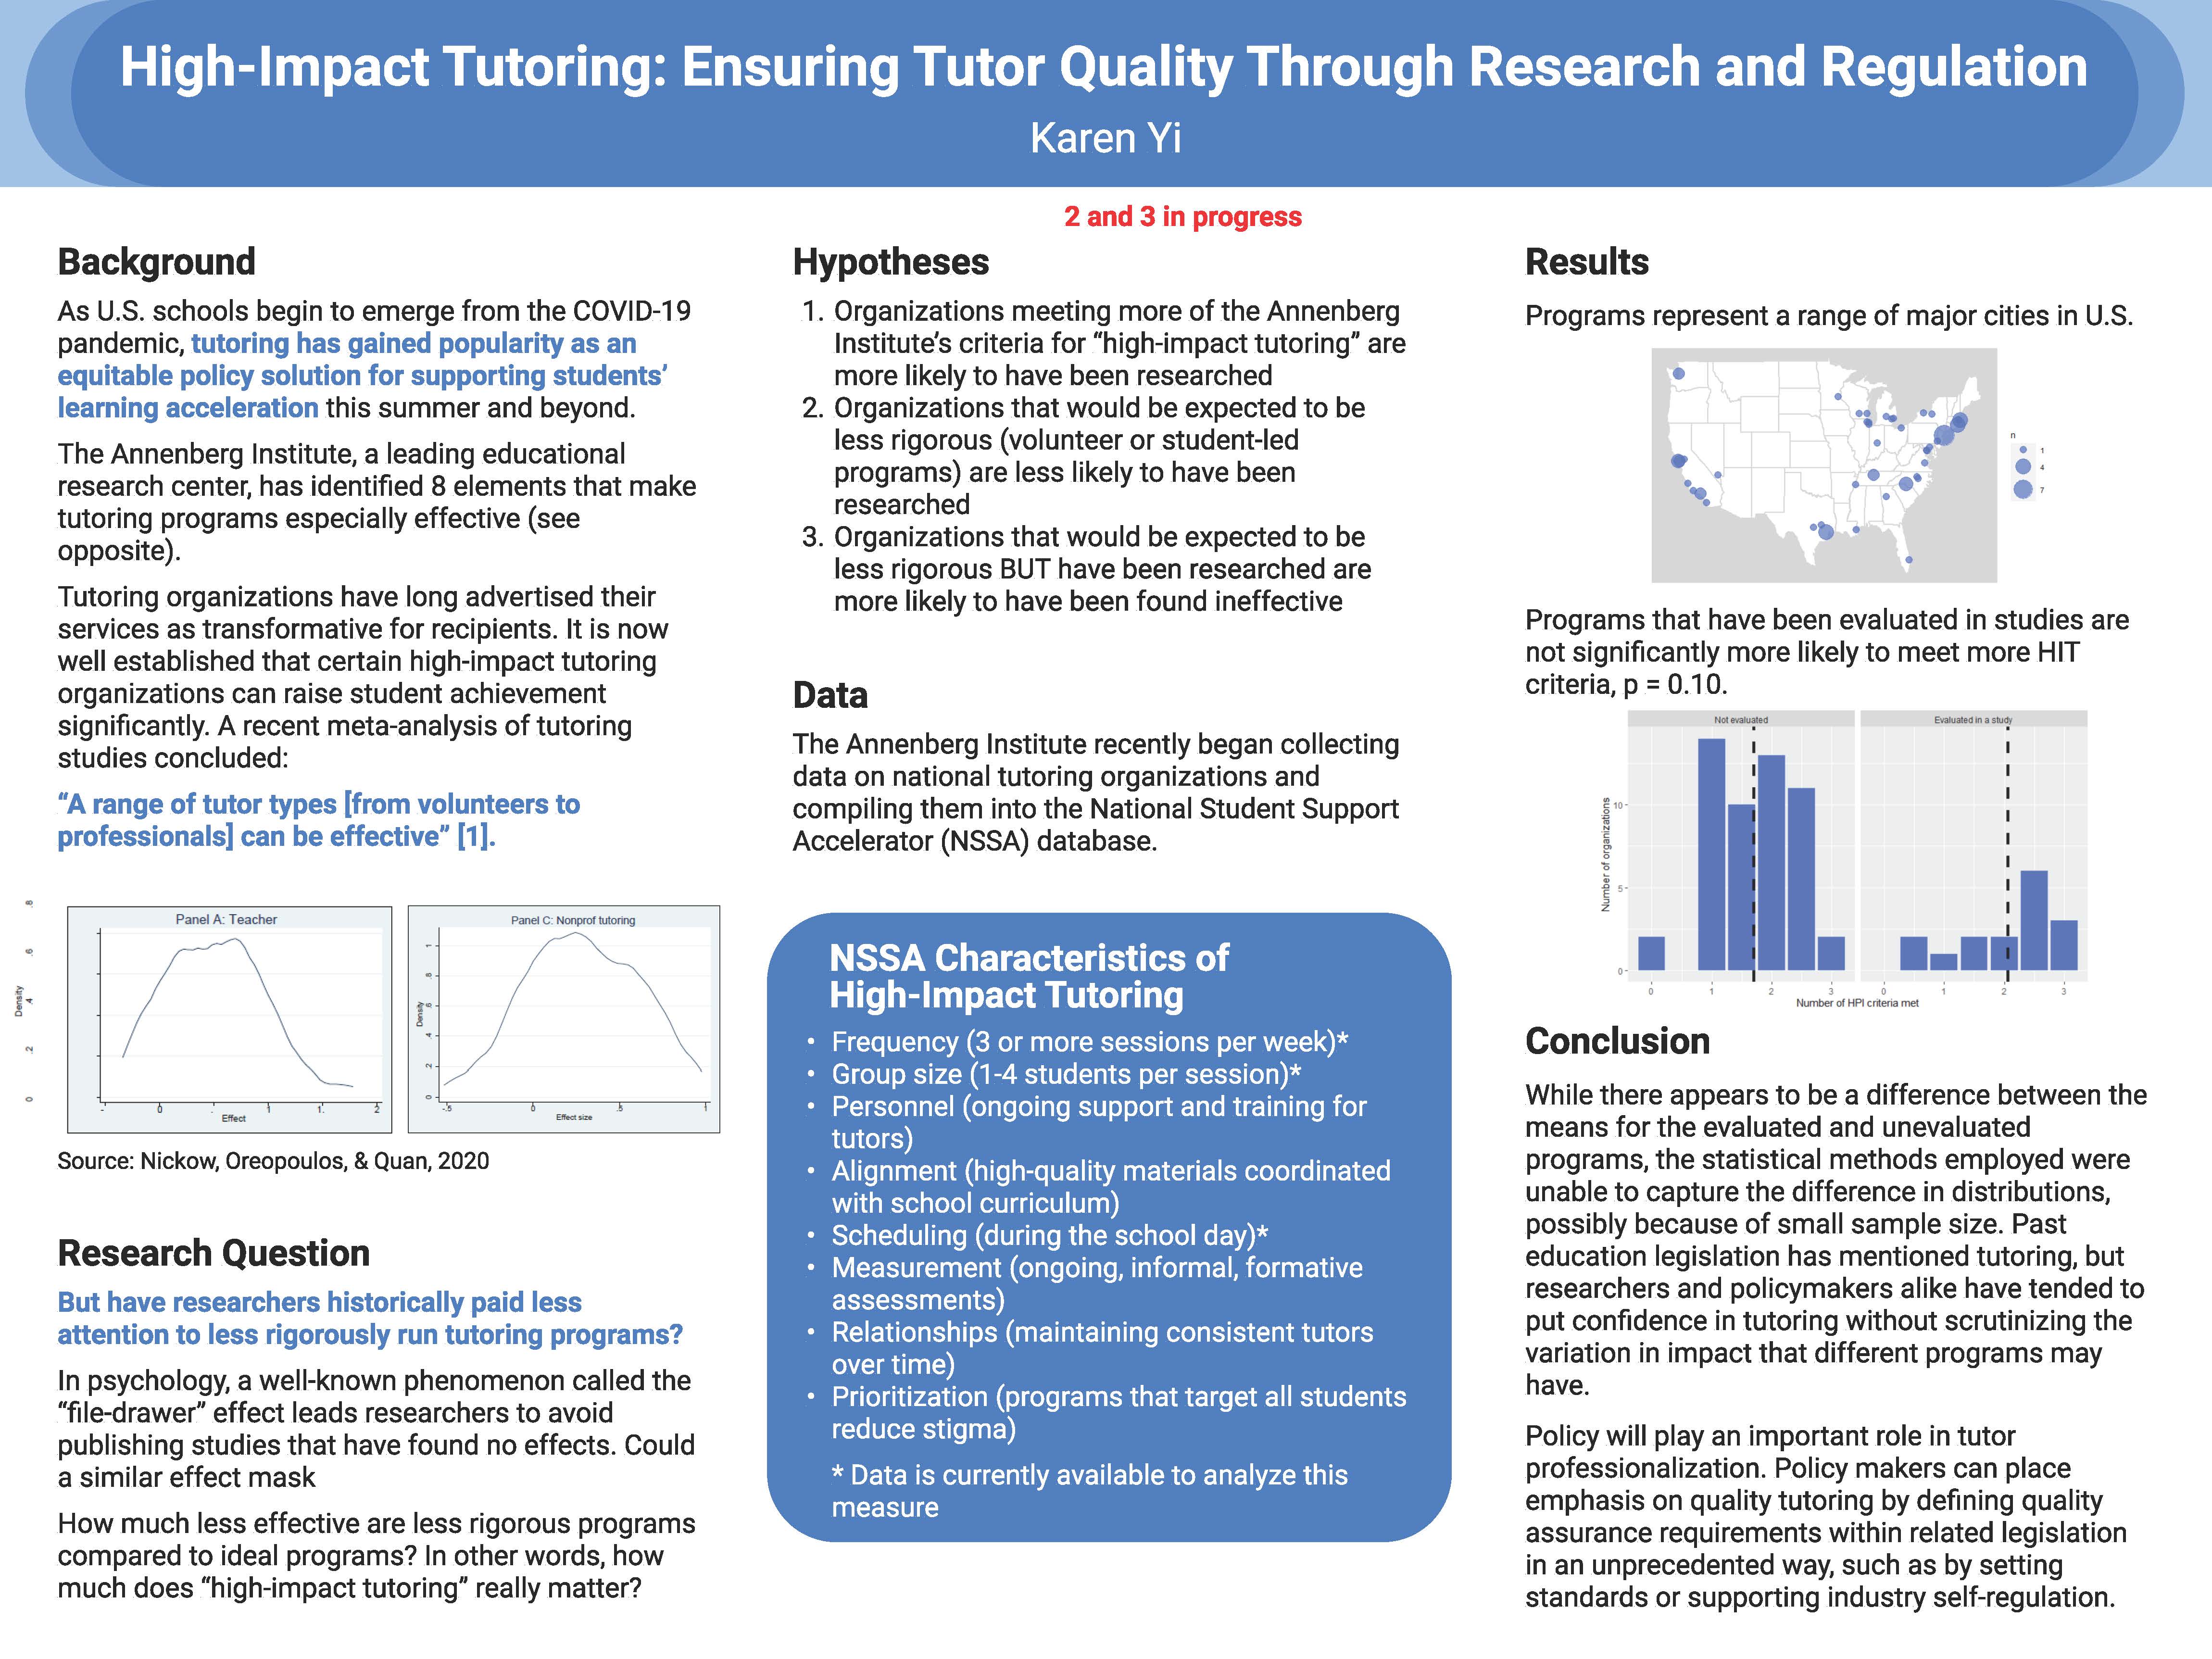
I created a poster summarizing the main findings of my study and suggestions for future directions.
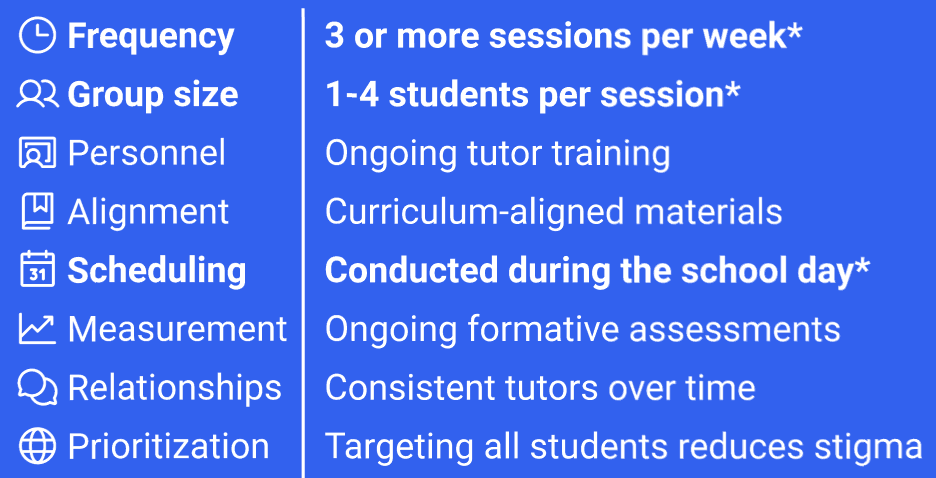
For maximal control over the visuals of my final product, I used Figma instead of a presentation-making application. Below is an early draft of my poster, with distracting graphical elements and dense text. For the final draft, I made the tutoring best-practices highlight easier to read with graphic icons (as per my advisor's suggestion), and reduced the amount of text significantly while retaining relevant information.
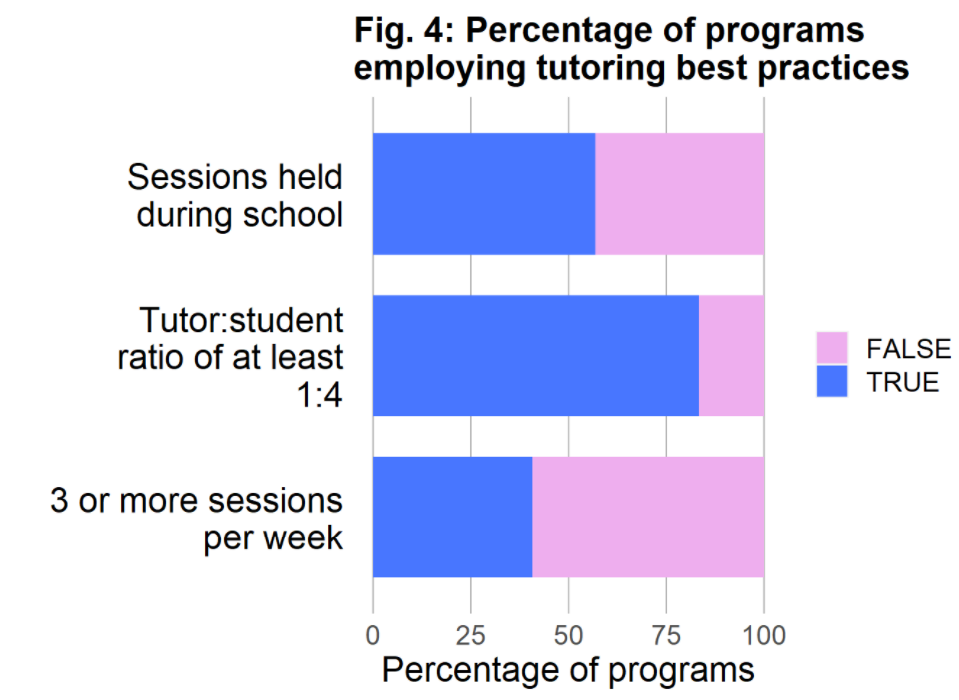
The New York Times' Upshot pieces are my go-to examples of digestible data visualization and a direct source of inspiration for the graphics in this project. Their use of rotated graphs (for more detailed X-axis labels) and minimalistic coordinates are visible in my finished products. I used the ggplot package in R to create highly customized figures.
Throughout the length of this project, I met regularly with my two advisors, who gave me suggestions on specific data to analyze, as well as improving the poster and organizing the paper. My program cohort also gave each other feedback on our poster presentation speeches and helped each other make more accessible final products.
in action
I presented my poster to my supportive team at UC Sacramento and the California Department of Education and received feedback on delivery and legibility. Click on the image below for an expanded view.